Every water cooler bottle comes back. The packaging around it never does.
By Zenith Water Dispense Team ·
The 19 litre water cooler bottle goes back to the plant and gets refilled. The cap on it and the film around the pallet do not. New EU packaging rules put that waste stream on the record, and most water dispense operators have never measured what it costs them.
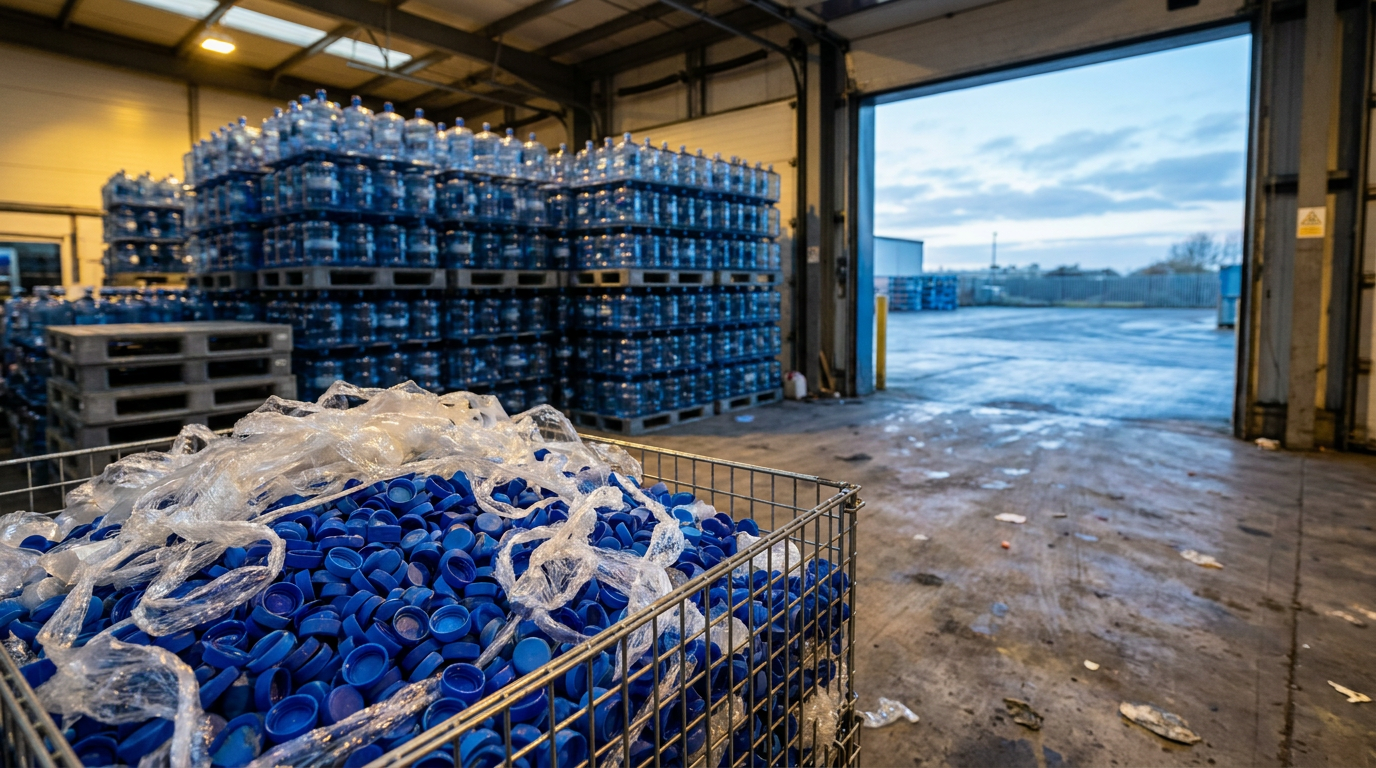
If I ran a bottled water cooler fleet, my next audit would start on the loading bay. I would count everything that leaves the yard wrapped around the bottles. Almost none of it comes back.
Watercoolers Europe put this on the record on 7 September. The trade body ran a live webinar on the EU packaging rules and the bottled water trade. Its clearest point was that most operators do not measure the packaging waste they already pay for.
What the session actually said
The EU Packaging and Packaging Waste Regulation, or PPWR, came into application on 12 August 2026. Further rules on labelling, collection and recycling land between 2028 and 2030.
The regulation puts prevention and reuse above recycling. That ranking suits the bottled trade well. BWD means bottled water dispense. Water arrives in 15 or 19 litre bottles, which the operator collects and refills.
The speakers were Olivia Dupuis of Aqua Pyrénées International and Craig Scott. Scott has visited close to 500 bottling plants for this industry. Their practical list was short:
- drop disposable stretch film
- cut bottle damage in transit
- move caps and preforms into returnable bins
They also told operators to audit the shrink film and cardboard that nobody currently counts.
The reuse story stops at the cap
A 19 litre bottle makes many trips before it retires. The cap on it makes one.
Every filled bottle leaving a plant carries a new cap. Every pallet carries film. Plenty carry a cardboard tray as well. The bottle is the reusable part, and almost everything protecting it is binned on arrival.
The volumes are not small. Take one large Southern European market our models cover. Its bottled fleet takes in tens of millions of filled bottles a year. That is the same number of caps, before you count the film and the board.
Why this cost stays hidden
The money is real. It sits in three different budgets.
Film and cardboard are warehouse consumables. Broken bottles are an asset write-off. Waste collection is a facilities bill. No single manager owns the total, so no single manager is asked to cut it.
Route cost gets managed hard in this industry. It lands on one line and someone answers for it. Packaging never works that way.
What a buyer does with this
Here is where it turns into money. A bottled book carries a packaging and breakage drag inside its gross margin. The seller usually cannot size it.
Ask two questions before you buy. What do film and board cost per thousand deliveries? How many bottles were written off last year?
Most sellers cannot answer either one, which tells you the number has never been managed. That makes it the cheapest margin in the deal. It needs no price rise and no new customer.
The leg bottled operators already pay for
Bottled dispense starts this one in front. Its trucks already drive back to the depot.
That return leg is paid for whether it runs empty or full. Collecting film, caps and pallets on it adds very little. A return journey you already run is the cheapest take-back scheme in the drinks trade.
POU means point of use, a cooler plumbed into the mains. ITS means instant tap systems, the counter units that pour hot, cold and fizzy water. An operator in either format has no return leg at all. Building one means a new cost line from scratch.
Bottled keeps giving up office share to mains-fed water, and that shift carries on. On take-back economics it holds the better hand, and it should say so in writing.
Two numbers worth putting on a page
First, single-use packaging weight per thousand bottle deliveries. Film, board and caps together, in kilograms.
Second, bottles lost or broken last year as a share of the bottles you own. Damage in transit is a cost and a compliance story at the same time.
The rules keep tightening through 2030, and customers keep asking for proof. Operators who can answer those two questions will be quoting them by then. The rest will be estimating on the call.
📈 Want the benchmarks behind numbers like these?
Access water dispense data, pricing benchmarks and operator insight that is not published anywhere else.
P.S. Do you know what your bottled route spends on packaging you throw away? The 2026 Zenith Water Dispense Market Reports cover more than 30 markets. That is every West and East European market, with Japan, Turkey, UAE, South Korea and Mexico on request. Each one is a full BWD, POU and ITS model. It carries operators and shares, the B2C and B2B split, revenue and a 2019 to 2030 outlook. Excel, with the written report on request. Built on the world's largest water dispense database. See them here: https://waterdispenseinsights.com/reports